Naples Market Report November 2018

Naples Market Report November 2018

Naples Market Report November 2018

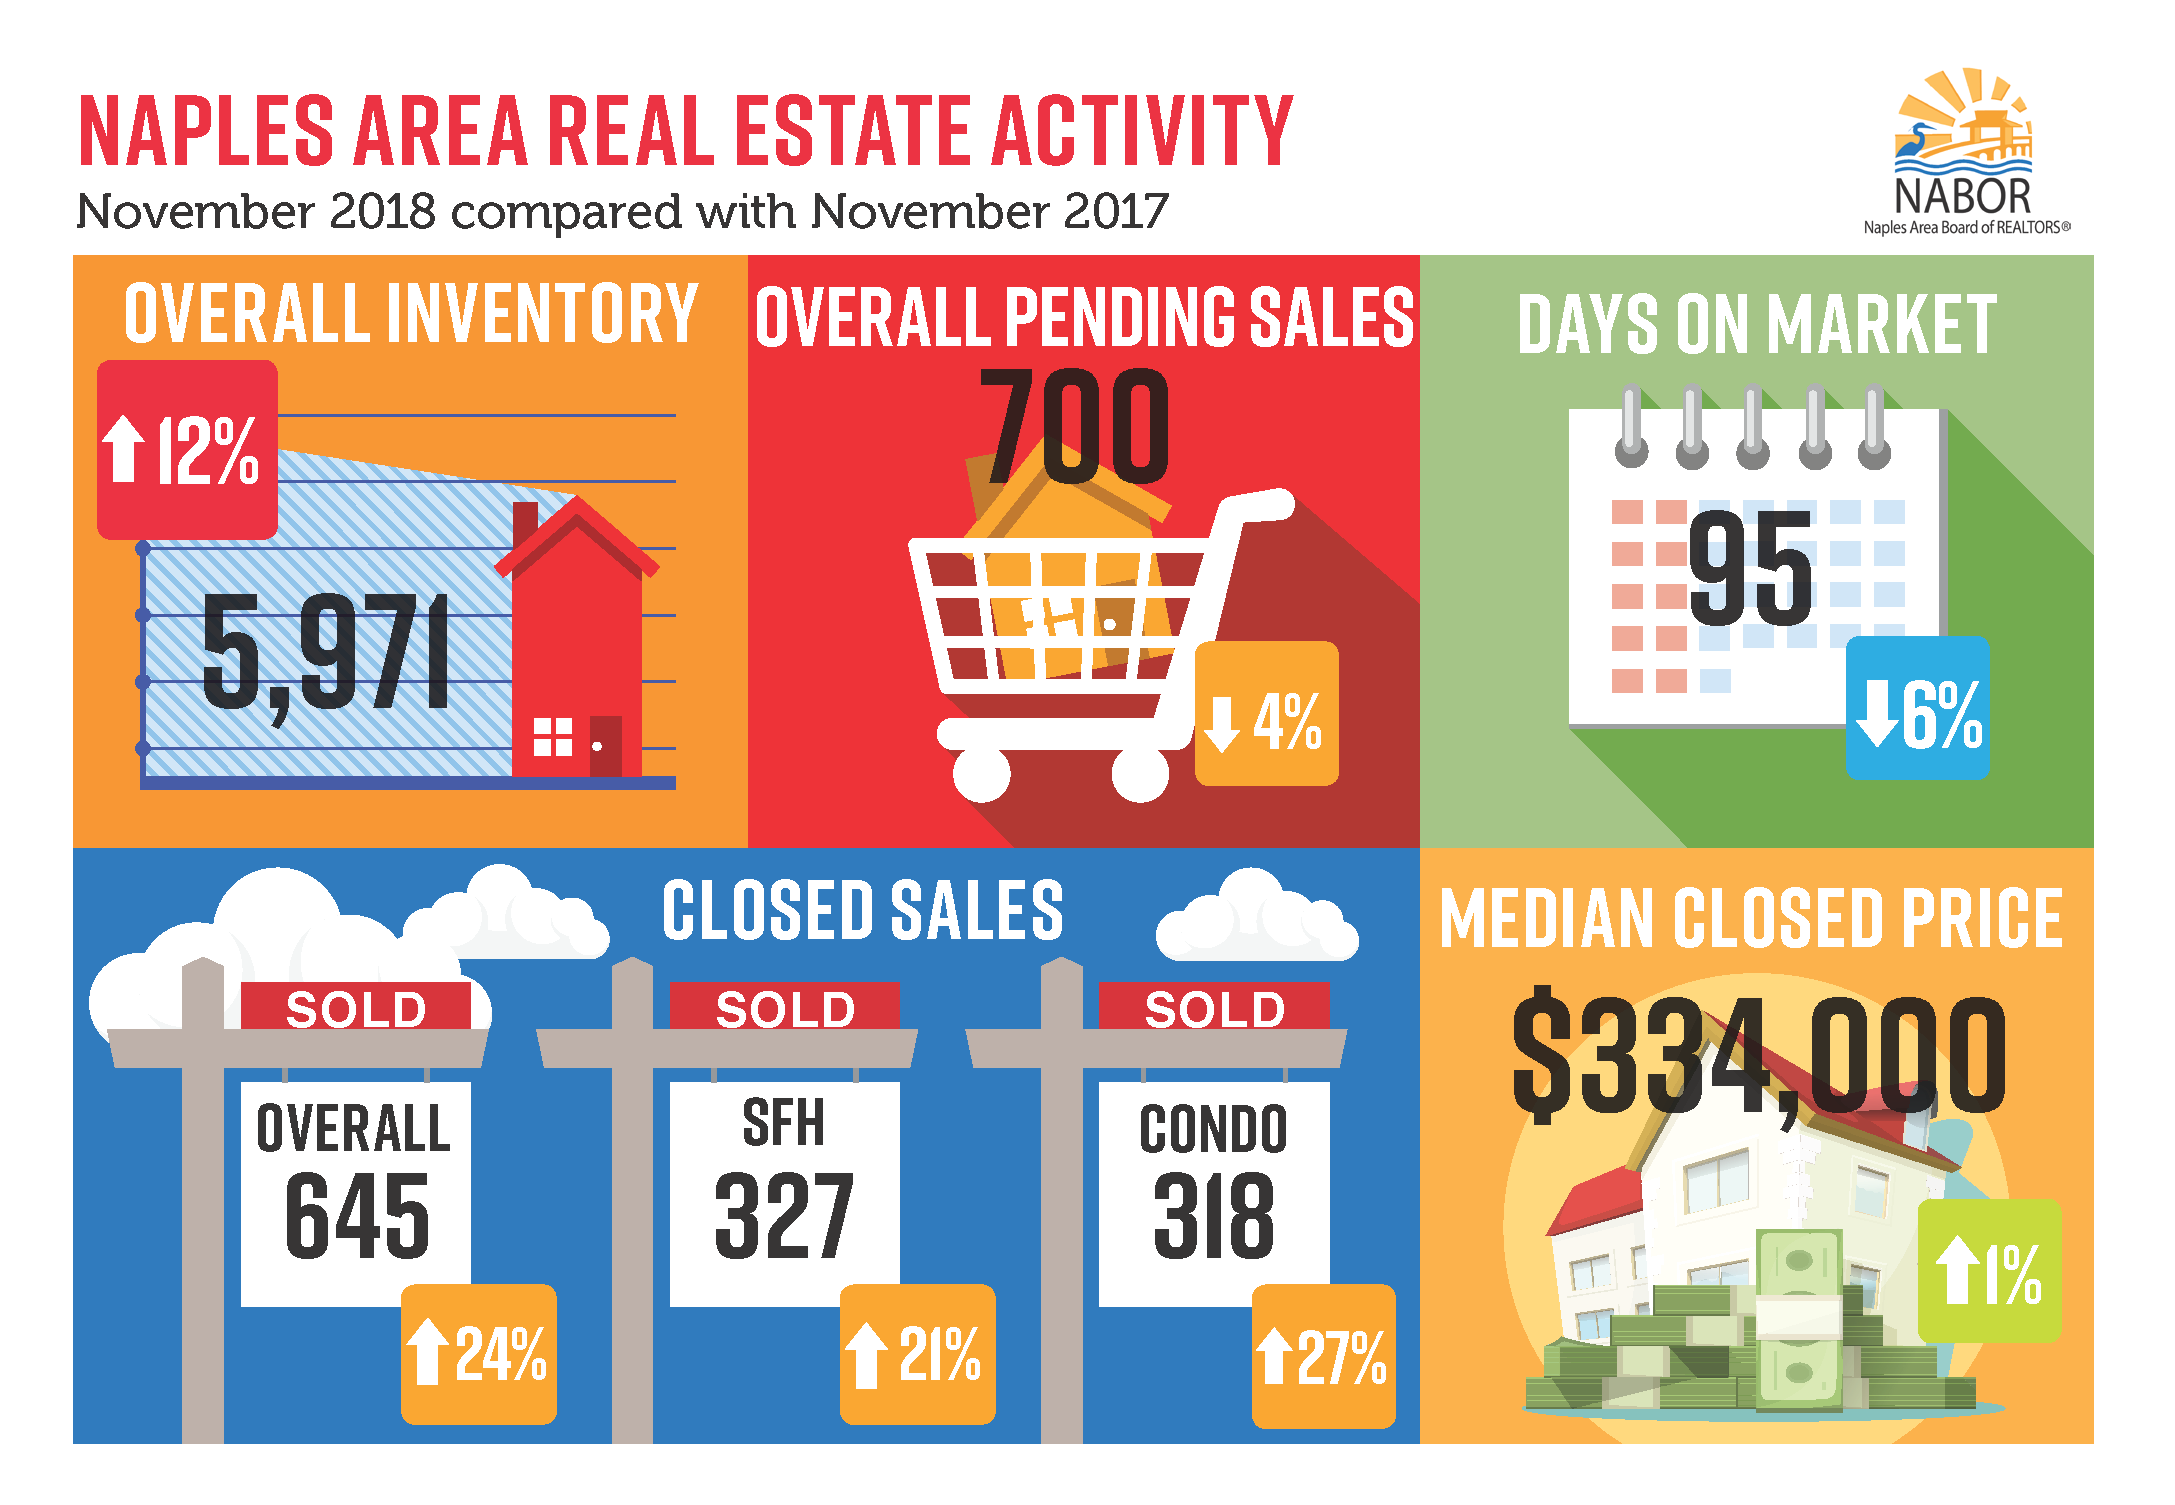
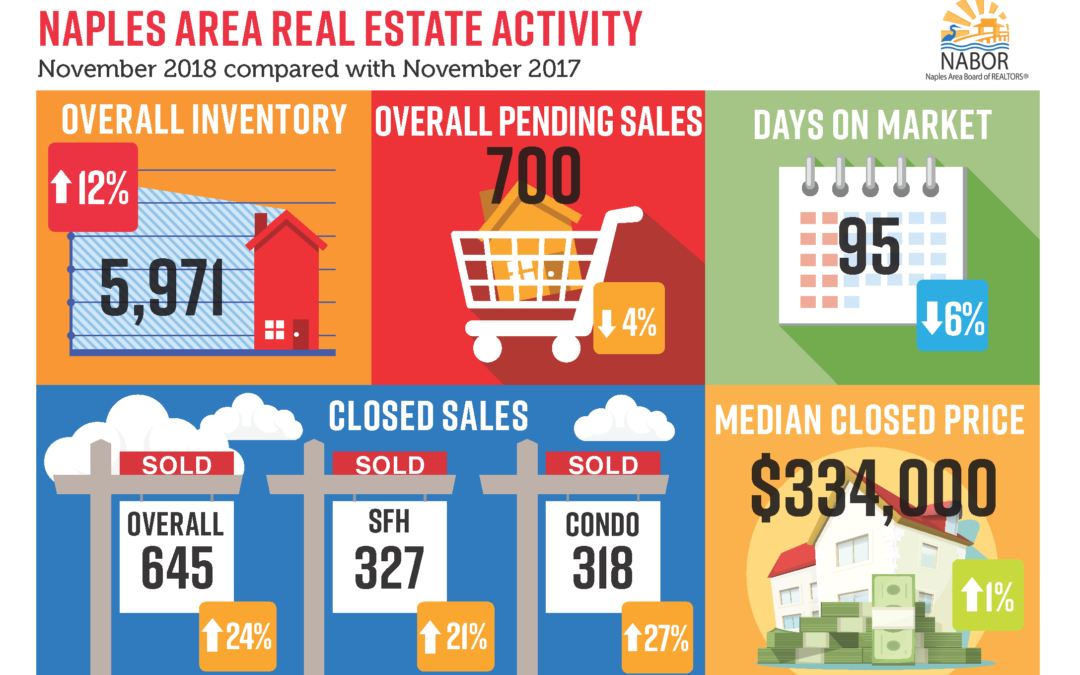
Home sales in November increased by double digits across every price category resulting in an overall increase of 24 percent compared to November 2017. Median closed prices decreased for homes under $1 million in November and inventory rose 12 percent to 5,971 homes, according to the November 2018 Market Report released by the Naples Area Board of REALTORS® (NABOR®), which tracks home listings and sales within Collier County (excluding Marco Island).

The $0 to $300,000 single-family home market had the most impressive activity in November where inventory rose 38 percent and closed sales increased 30 percent compared to November 2017. This section of the market also saw its median closed price hold steady at $250,000. “New home construction in the lower price tiers is rushing to meet the needs of buyers and it’s building our inventory in much needed areas within eastern Collier,” said Mike Hughes, Vice President and General Manager for Downing-Frye Realty, Inc. The November market report supports Hughes’ claim as the East Naples area (34114, 34117, 34120 and 34137) saw the highest number of closed sales for single-family homes – 105 – with another 121 sales pending.

Broken down geographically, Collier’s housing market in November had some interesting pockets of activity. For example, median closed prices decreased 19 percent in the Naples Beach area (34102, 34103, 34108); but increased 12 percent in the North Naples area (34109, 34110, 34119). There was a 90 percent increase in closed sales of condominiums in East Naples (34114, 34117, 34120, 34137), which brokers attribute to an increase in new construction of townhome developments east of Collier Boulevard. And single-family homes in Central Naples (34104, 34105, 34116) sold the fastest with an average 66 days on the market from listing to closing.

Source :  https://www.nabor.com/clientuploads/Market%20Statistics/November%202018%20Stats/November_2018_Market_Report.pdf

Naples Market Report / Statistics for Month of October 2018

Naples Market Report / Statistics for Month of October 2018

Naples Market Report / Statistics for Month of October 2018

Closed sales of homes in the Naples market grew 20 percent to 674 sales in October 2018 compared to 561 sales in October 2017. The last few months have seen not only a return to a steady housing market for Naples since Hurricane Irma, but also an increased buyer appetite for homes in Collier County. We are pleased to report that inventory during October jumped 20 percent to 5,992 homes – the highest October inventory level since 2012 – which is good news for buyers according to leading broker analysts who reviewed the October 2018 Market Report released by the Naples Area Board of REALTORS® (NABOR®), which tracks home listings and sales within Collier County (excluding Marco Island).

Overall pending sales for October were up 17 percent with the $1 to $2 million price category reporting the highest increase (39 percent) for the month compared to October 2017. The October report also showed the overall median closed price increased 1 percent to $344,000 from $342,000 in October 2017; but went down 1 percent for homes priced over $300,000 to $475,000 from $480,000 in October 2017. Interestingly, the median closed price in the Naples Beach area decreased 13 percent in October to $595,000 in October 2018 from $682,000 in October 2017. However, in the 12-months ending October 2018, the median closed price rose 4 percent to $344,000 from $330,000 in the 12-months ending October 2017. In the Naples Beach area, the median price rose 4 percent in the 12-months ending October 2018 to $790,000 from $763,000 in 12 months-ending October 2017.

Source:

https://www.nabor.com/clientuploads/Market%20Statistics/October%202018%20Stats/Print_this_article.pdf

https://www.nabor.com/clientuploads/Market%20Statistics/October%202018%20Stats/Oct2018Info_(002).jpg

Naples Real Estate Market March 2016 Trends

Naples Real Estate Market March 2016 Trends

Naples Real Estate Market March 2016 Trends

Naples Real Estate Market March 2016

Naples Real Estate Market Trends Numbers for March 2016

According to the Naples Area Board of realtors report, we had a 5% drop in sales in the last 12 month period until March 2016. But when we look at the record numbers of 2015, this drop in sales doesn’t seem much in that respect.

With inventories up 33% in the first quarter of 2016 and prices of homes in the $300K and above holding steady and strong , it indicates a market that is stabilizing. Our big winners being an 11% inventory increase in the $500K to $1M SFH price range and an 61% inventory increase in the $1M to $2M condominium in March 2016 and all of this while the average days on the market decreased 4% to 76 days from 79 days the same month in 2015.

Now, how is this good news to buyers, sellers and realtors alike? Well, Buyers will benefit from the increased inventory and will have more choices in the homes to buy. Now sellers with homes in the price range of $300K and above will benefit because they see their home prices holding steady, however the increased inventory may force some sellers to be more flexible and realtors will have the increased inventory to work with and help buyers with more options to choose from all while keeping sellers happy as prices hold for the moment.

Overall the market stabilization in 2016 will contribute to the better health of our Naples Real Estate Market in the long run in finding that happy medium between sellers and buyers.

Pin It on Pinterest